Wearable Health Trackers and the Metrics That Actually Predict Risk
Trends in fitness, glucose and heart rate matter more than individual readings.
Wearable health trackers can reveal patterns linked to cardiovascular and metabolic risk, but a useful signal is not the same as a diagnosis. The strongest case is for following a few measures over time, including fitness, resting heart rate, glucose patterns and sleep regularity. Their value grows when they help identify a reason for clinical testing.
Why wearables still haven't solved the clinical validation problem
The Holter monitor established a principle that still guides wearable health tracking. An ECG during a short clinic visit might miss an arrhythmia that longer monitoring reveals. Duration changes what can be found. Today, medical-grade devices and consumer wellness products are approaching each other, with Dexcom’s Stelo, the first over-the-counter continuous glucose monitor cleared by the FDA, showing how a once-prescription device can become directly available to consumers.
Regulation is changing with that shift. CMS launched the ACCESS payment model, while the FDA launched the companion TEMPO pilot program to help public health insurance cover the use of certain digital health devices in chronic care as companies collect real-world data. Wearable output is not held to the same validation standards as laboratory tests, and proprietary algorithms and composite wellness scores make that gap harder to close.
What continuous monitoring can detect that a clinic visit cannot
A clinic visit cannot show what happens over weeks of ordinary life. Wearables record how physiology changes with events, behavior and interventions. The CoDaS paper from Google Research, Google DeepMind, MIT and other institutions describes how continuous heartbeat, activity, sleep and temperature data can surface early physiological deviations. Patients have also credited Apple Watch alerts with prompting care for previously unrecognized arrhythmias.
Fasting plasma glucose and HbA1c are clinical gold standards for screening blood sugar, but neither shows how it changes throughout daily life. A continuous glucose monitor, or CGM, does. The Physiological World Model framework from Peking University and Fullive-AI argues that health AI needs to model these transitions, rather than rely mainly on isolated observations of current state or future risk. Continuous signals therefore need enough validation to support decisions.
VO₂ max: the longevity signal that consumer smartwatches can now estimate
Of the metrics that consumer wearables can track, cardiorespiratory fitness, as estimated through VO₂ max, has the strongest and most consistent link to all-cause mortality. It sets a demanding benchmark for other signals. The relationship is not linear, with the largest survival benefit associated with moving out of the lowest fitness category, rather than moving from average fitness to elite performance.
But does a smartwatch estimate deserve the confidence given to the underlying measure? Consumer estimates are indirect and depend on algorithms. The strongest evidence for fitness does not make every device reading equally precise. For readers tracking progress, the useful application is following a trend over time on the same device. A sustained trajectory has more clinical value than treating one displayed number as an exact measurement.
HRV and resting heart rate: what autonomic signals do and don't tell you
Heart rate variability, or HRV, and resting heart rate provide information about autonomic and cardiovascular function, but their interpretation is less straightforward than fitness. ECG-derived HRV may show how autonomic and cardiac responses are linked to acute glucose changes, which also links the signal to metabolic health. The measurement method is central to that interpretation. An ECG-derived finding does not automatically validate every consumer device’s version of HRV.
Manufacturers use different algorithms and measurement windows. An Apple Watch value and an Oura Ring value therefore cannot be treated as interchangeable, even when both are labelled HRV. An apparent biological change between devices may reflect differences in calculation. Within-device trends are more useful, though short-term fluctuations still need to be distinguished from sustained shifts.
Resting heart rate has a firmer measurement footing. Wearables measure it with high accuracy, but an accurate number still needs context. CoDaS identified a wearable cardiovascular-fitness index based on steps divided by resting heart rate, illustrating the value of interpreting heart rate with activity level. A resting measurement on its own cannot show why heart rate has changed or whether the change points to a higher risk.
Continuous glucose monitoring outside diabetes: what the Framingham data established
Researchers at Boston University Chobanian & Avedisian School of Medicine analyzed CGM data from Framingham Heart Study participants without diabetes or cardiovascular disease. Higher mean glucose and greater time above 140 mg/dL were associated with hypertension and elevated cholesterol. Emerging longitudinal data from the same substudy also suggest that more time above that level is associated with cardiometabolic outcomes, including progression to type 2 diabetes. The pattern adds information beyond a blood draw. These associations do not, however, make an individual excursion a diagnosis.
Evidence on personalized exercise timing found that beginning a walk before an individual’s postprandial glucose peak significantly reduced postprandial glucose, insulin and C-peptide levels. That is a concrete use for continuous feedback. Stelo makes this data available without a prescription, while Apple’s HealthKit can bring CGM and wearable signals together and add lab results through Health Records from providers that take part. People can now get this data, but there are still no standard reference ranges to help metabolically healthy users interpret it.
How wearables improve insulin resistance prediction when combined with a blood panel
The WEAR-ME study, published in Nature in March 2026, tested whether wearable data could strengthen conventional metabolic assessment. People across the United States joined the study remotely through the Google Health Studies application. Median age was 45 years, median BMI was 28 kg/m², and median HbA1c was in the normal range. Insulin resistance is a primary precursor to type 2 diabetes, yet expensive and inaccessible diagnostic methods can hinder early intervention.
The study combined wearable time-series data, demographics and routine blood biomarkers to predict insulin resistance against a HOMA-IR measure. Adding wearable-derived representations made the predictions much better than those from a model that was otherwise the same and used demographics, fasting glucose and a lipid panel. The wearable foundation model had been pretrained on tens of millions of hours of sensor data. In an independent validation cohort, wearable representations combined with demographics also outperformed demographics alone.
The study shows that activity and sleep data can add predictive information to basic, inexpensive blood tests.
Sleep architecture as a risk signal: what wearables measure and what they cannot stage
A wearable’s sleep chart is an estimate. Smartwatches and fitness bands use motion, heart rate, skin temperature and other signals to infer sleep patterns. They are not staging sleep in the same way as a sleep laboratory. Because classification algorithms differ across platforms, the same night can produce different stage breakdowns on different devices.
The better-supported signal is often regularity. CoDaS found associations between depression and variability in sleep duration and sleep onset across three independent cohorts. Changes that last in sleep timing, total duration or resting heart rate during sleep are thus more useful than the stage percentages from one night.
There is also information in the underlying sensor signal. PpgAge, published in Nature Communications in 2025, used photoplethysmography from consumer wearables to predict biological age in a very large population. Its findings suggest that the sensor in many smartwatches contains information about aging trajectories, including those shaped by chronic sleep disruption. That potential should not be confused with validation of every sleep-stage chart built from it.
Where wearable accuracy falls short and why it matters for decisions
Resting heart rate and step counts are generally accurate, while consumer readings for blood pressure, arrhythmia detection and SpO₂ can be wrong by notable margins. Cuffless blood pressure methods differ so much that their readings cannot be relied on to manage hypertension.
Single-lead ECG apps can catch obvious atrial fibrillation episodes, but they can miss intermittent or complex arrhythmias. False positives can also prompt unnecessary emergency room visits.
Composite scores add another layer of uncertainty because their inputs and weightings may be hidden. Open Wearables launched open-source health scoring algorithms in April 2026, with documented, versioned and publicly verifiable calculations intended to address that opacity. Transparency makes a calculation easier to examine. It does not, by itself, establish that acting on a score improves health. The distinction is between understanding how a number was produced and knowing what decision it can support.
The biomarkers wearables cannot yet measure but proactive patients should still track
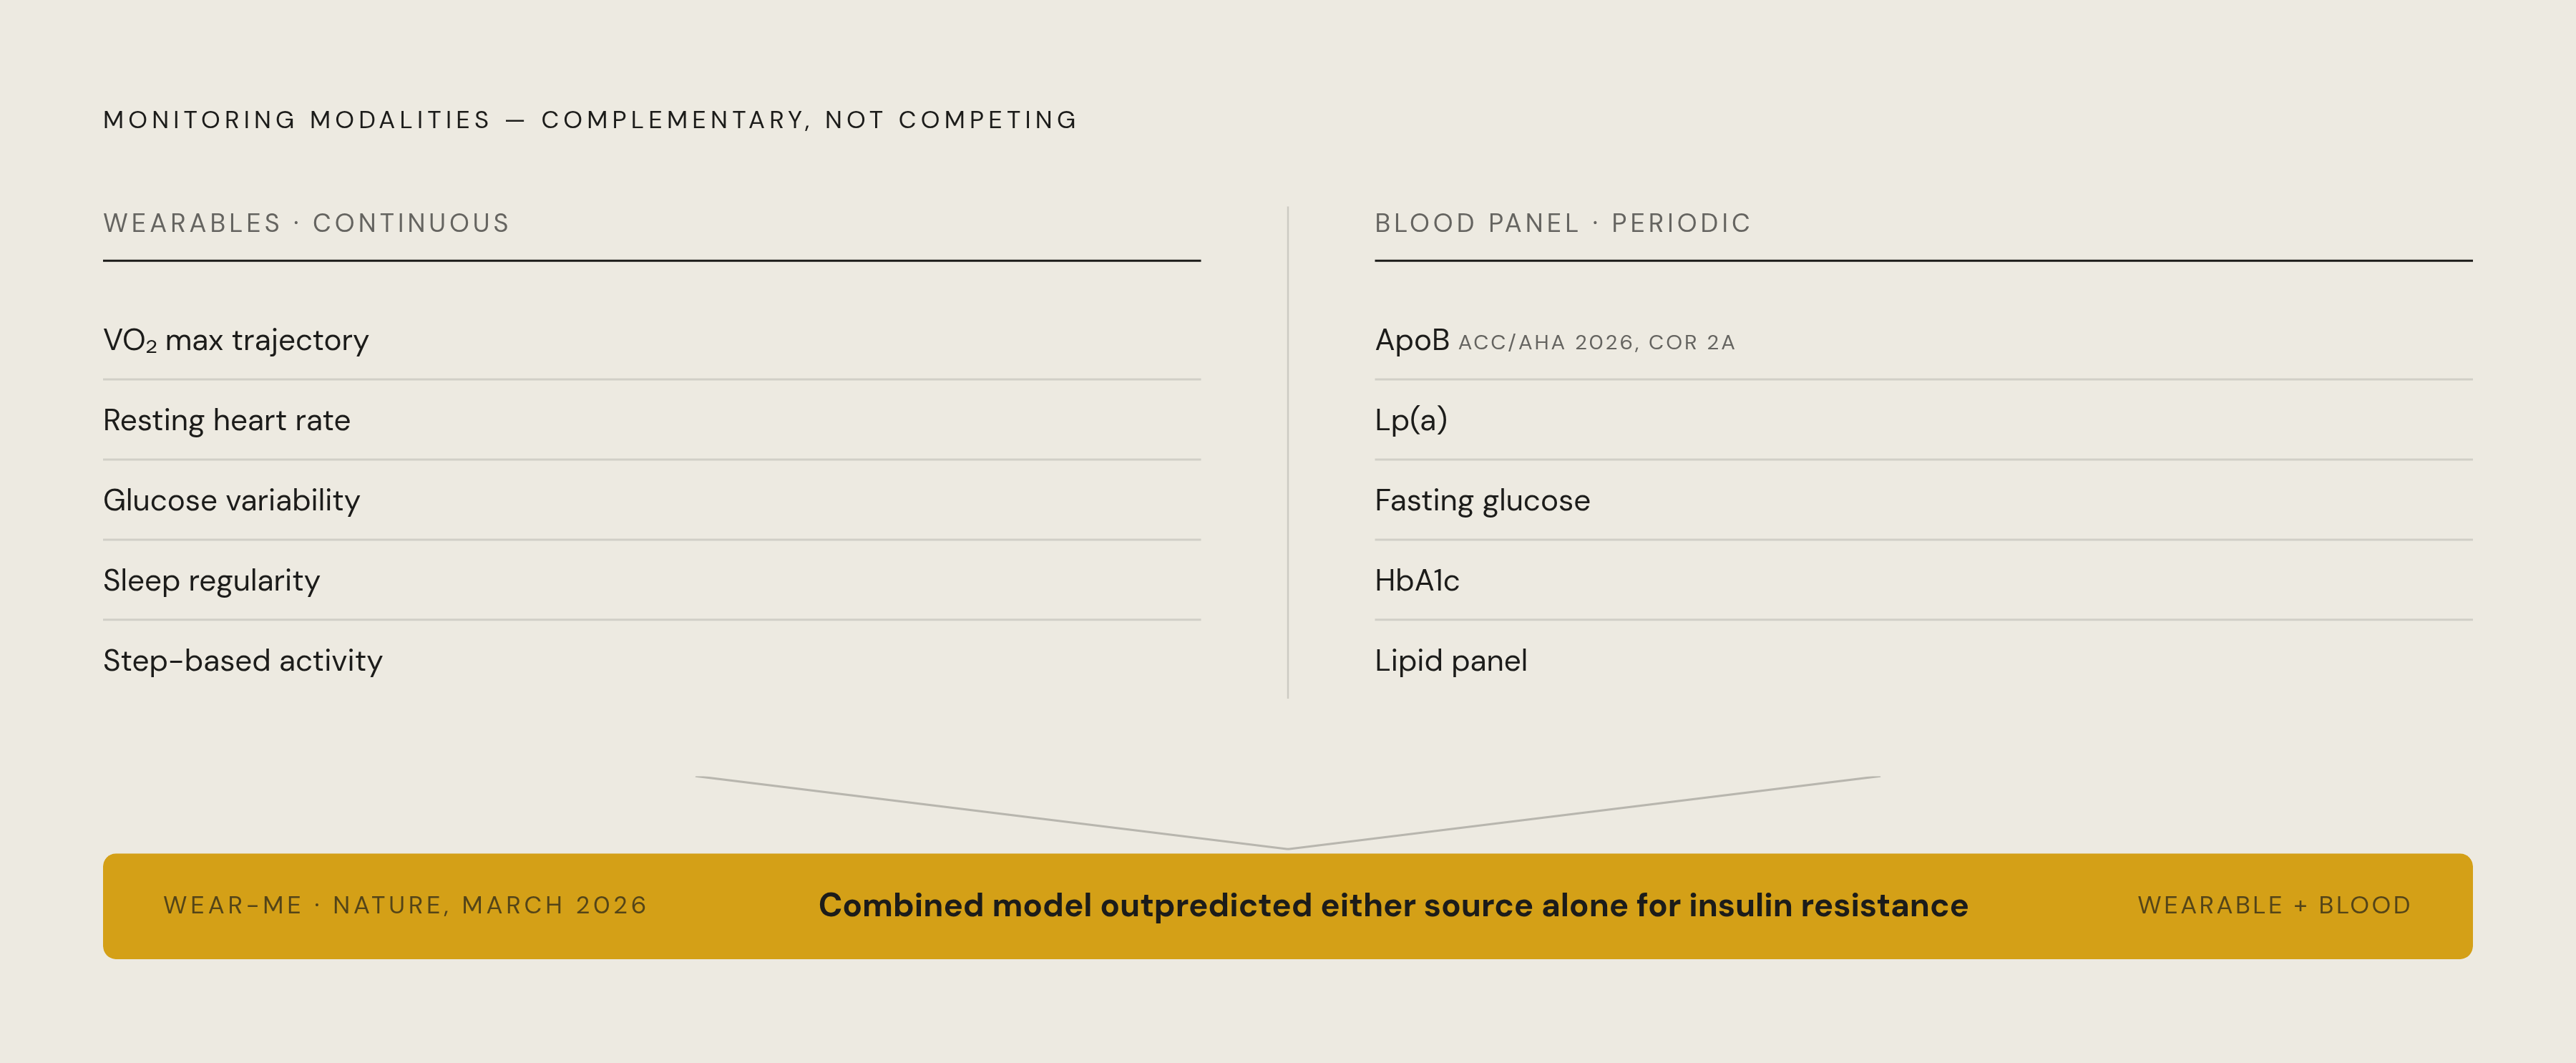
Blood is still needed to measure several important cardiometabolic risk markers. The 2026 ACC/AHA Dyslipidemia Guideline gave ApoB substantially elevated standing as a formally recommended measurement, COR 2a, particularly in patients with diabetes, triglyceridemia or very low LDL cholesterol. ApoB directly quantifies the number of atherogenic lipoprotein particles independently of their cholesterol content. No consumer wearable supplies that measurement.
ApoB also has practical advantages for testing. It is directly measured rather than calculated, is not meaningfully affected by fasting status, and remains reliable where LDL estimation is prone to error. The same guideline also elevated the clinical standing of Lp(a), another risk marker that current consumer wearables cannot track.
The practical framework is to use each source for what it can reveal. Wearables support continuous monitoring of VO₂ max trajectory, resting heart rate, glucose variability and sleep regularity. Periodic blood panels reach ApoB, Lp(a), fasting glucose, HbA1c and lipids. The WEAR-ME findings give this complementary approach an evidence base, because the improved model retained conventional blood biomarkers.
How to read your wearable data without over-treating noise as signal
Follow VO₂ max over months. Act on a sustained decline, rather than treating a single low estimate after a stressful week as meaningful deterioration. Resting heart rate needs similar patience. A sustained elevation over several weeks, especially without a change in training load or sleep, is worth investigating. Daily variation alone is not.
For CGM, examine the pattern as well as the average. Time above 140 mg/dL has the strongest epidemiological support from the Framingham substudy, but it is not a standardized diagnostic threshold for otherwise healthy users. For sleep, prioritize timing consistency and total duration trends over nightly stage percentages. Keep HRV comparisons within one device over time.
Some outputs call for a firmer boundary. Treat cuffless blood pressure readings as directional at best, and do not use them to diagnose or manage hypertension without a validated cuff measurement. Composite readiness and wellness scores may help motivation, but their often-unvalidated weightings should not drive clinical decisions. When a signal backed by evidence stays abnormal, the next step should be to look into it, including with a blood panel.