HOMA-IR as an Early Insulin Resistance Detector
A simple calculation catches insulin resistance years before standard blood tests do.

Insulin resistance sits quietly for years before a standard blood panel catches it. HOMA-IR is the calculation that flags it early, built from two numbers most people already have sitting in an old lab report: fasting glucose and fasting insulin. Researchers at Oxford, led by Matthews and colleagues, published the model in Diabetologia back in 1985. It has held up remarkably well for something built decades before insulin resistance became a mainstream concern.
The math is simple. Multiply fasting insulin (in µU/mL) by fasting glucose (in mg/dL), then divide by 405. If the lab reports glucose in mmol/L, divide by 22.5 instead. Both numbers need to come from the same blood draw, taken after 8 to 12 hours without food. Eat breakfast before the draw and the whole calculation falls apart, and there's no fixing a non-fasting sample after the fact. The test just has to be redone.
The formula only makes sense once you see the feedback loop behind it. The liver releases glucose into the blood, the pancreas notices, and it releases insulin in response. That insulin tells cells to pull the glucose in and use it. In a well-functioning system, a small amount of insulin gets the job done. When cells stop responding the way they should, the pancreas compensates by pumping out more of it, just to keep glucose in a normal range. HOMA-IR captures how hard the pancreas is straining to hold that line. A high ratio means the system is working overtime, even if the glucose number by itself still looks fine.
Reading your HOMA-IR score against what counts as optimal
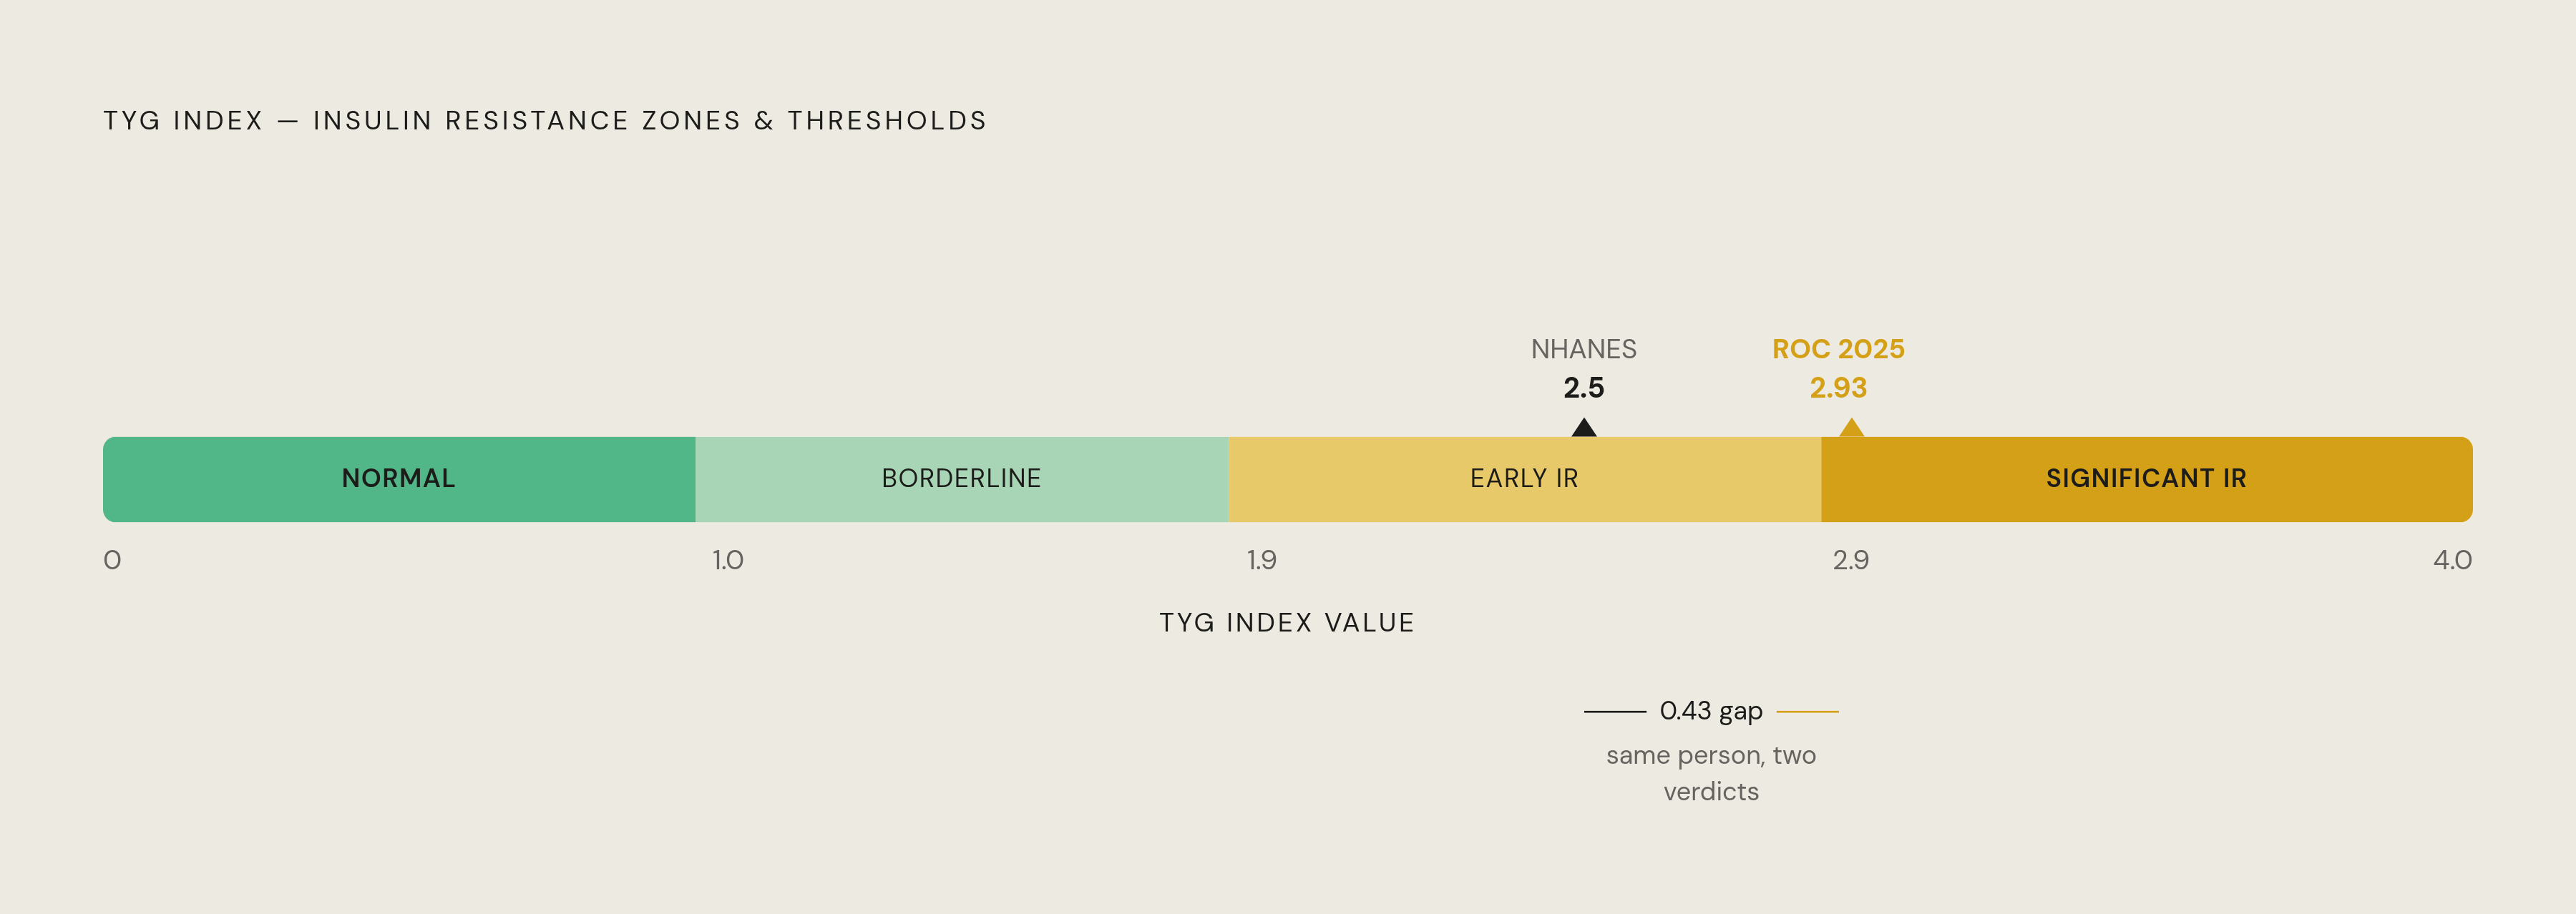
As a rough guide, a score below 1.0 points to normal insulin sensitivity. Above 1.9 suggests early insulin resistance is setting in. Cross 2.9 and significant insulin resistance becomes far more likely, warranting a closer look.
No single cutoff every lab or clinician agrees on exists, and that's exactly where most people trip up, fixating on one number as if it were gospel. Clinical and research settings tend to use values somewhere between 2.0 and 3.0 as the dividing line, and NHANES, the government's long-running health survey, sets its threshold at 2.5. International research shifts the numbers again: cutoffs used for metabolic syndrome and dysglycemia in Asian populations often run lower, typically in the 1.4 to 2.5 range. Body composition and baseline metabolic patterns differ across populations, so the cutoff moves with them.
A 2025 study using ROC-curve analysis on 515 participants found that a HOMA-IR above 2.93 was the best cut-point for predicting metabolic syndrome as a real-world outcome. That gap says something about how much imprecision still sits at the margins of this test. Two people can land on opposite sides of "elevated" depending on which chart their doctor happens to use, and they won't be facing the same actual risk. Chasing a single threshold number misses the point. What matters more is the trend over time and where the score sits relative to the other risk factors in the picture, not whether it clears 1.9 or 2.5 on one draw.
Why glucose and A1c miss the problem for years
HOMA-IR gets run precisely because of the compensatory mechanism from the last section. As cells grow more resistant to insulin, the pancreas doesn't throw in the towel. It fights back by secreting more of it. Glucose stays in a normal range for a long time because of that extra output. A fasting glucose test looks perfectly fine on paper while, underneath it, insulin climbs steadily. HOMA-IR is one of the few common tests actually built to catch that divergence.
Insulin resistance is thought to precede a type 2 diabetes diagnosis by a decade or more in a lot of cases. By the time fasting glucose or A1c crosses into abnormal territory, the pancreas has usually been overcompensating for years, not months. That's a long runway where something is clearly wrong metabolically, and the standard screening tools aren't built to see it.
So why does this keep happening at a systems level? Routine diabetes screening leans on fasting glucose and A1c because they're cheap, standardized, and well understood. Fasting insulin usually only gets ordered once glucose or A1c is already borderline, backwards if the goal is catching insulin resistance while it's still reversible. That ordering is backwards. If the goal is catching insulin resistance while it's still reversible, insulin needs to be checked before glucose drifts, not after it already has.
The practical result: a person can walk around with a completely normal fasting glucose and a fasting insulin level that's genuinely high. Normal glucose paired with elevated insulin is the textbook early-resistance signature, and standard screening, run in the usual order, misses it. It checks glucose first and often never gets around to insulin.
Insulin resistance prevalence and undetected burden by group
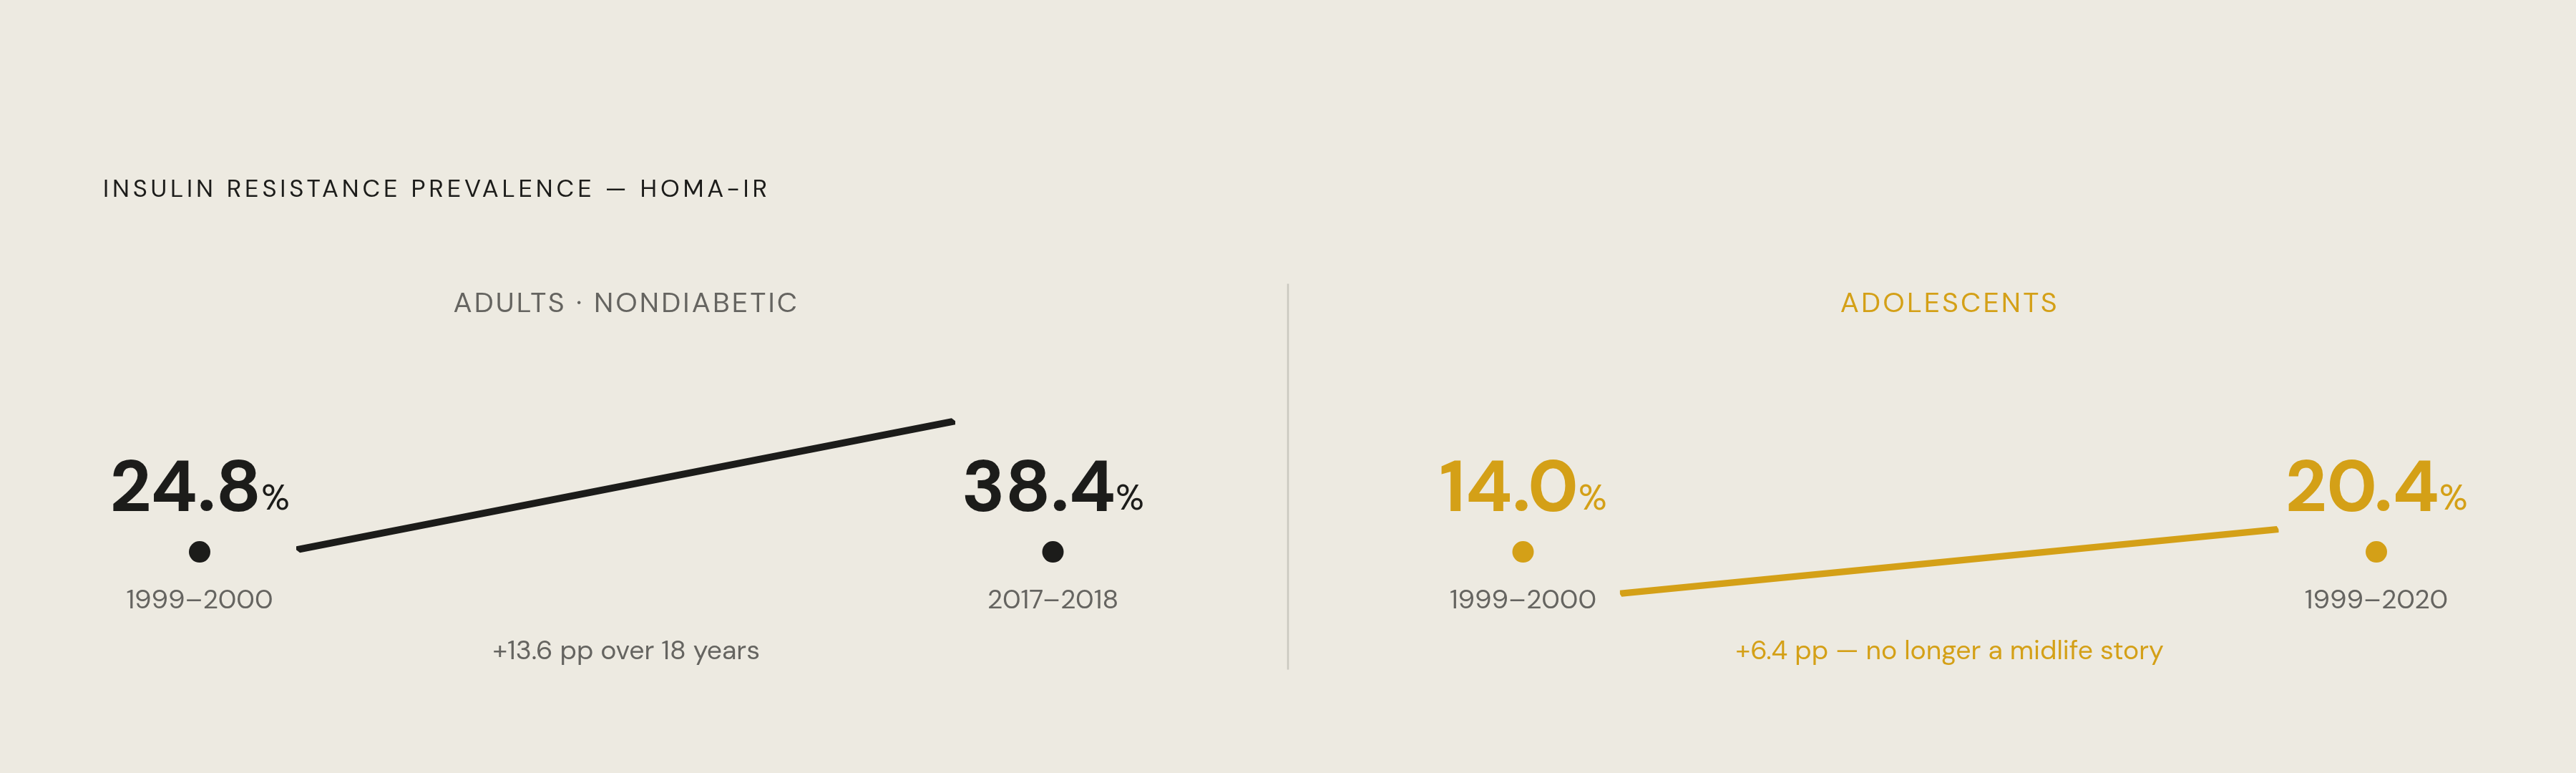
Among nondiabetic adults in NHANES, prevalence has moved sharply. Age-standardized hyperinsulinemia prevalence rose from 28.2% to 41.4% between 1999-2000 and 2017-2018. Insulin resistance prevalence, measured by HOMA-IR over that same stretch, rose from 24.8% to 38.4%. Both lines are climbing across the period studied.
What's more unsettling: this isn't only a midlife story. Among adolescents, estimated hyperinsulinemia prevalence rose from 15.2% to 21.5% between 1999-2000 and 2017-2020, a 3.35% relative increase. HOMA-IR-based insulin resistance in that same group rose from 14.0% to 20.4%, a 3.41% relative increase. Insulin resistance is starting earlier than most people assume, and that alone should push the conversation about screening age much younger than it currently sits.
The burden isn't distributed evenly either. Higher prevalence appears in males, non-Hispanic Black and Hispanic individuals, and people with lower education or income levels. If fasting insulin testing only happens once glucose is already borderline, the groups carrying more risk factors to begin with are also the ones most likely to get caught late. The system compounds the problem instead of balancing it out.
What drives HOMA-IR up, the modifiable factors
Body composition explains a large share of what pushes this number higher, and total body weight is the wrong thing to focus on. Visceral fat, the kind that wraps around internal organs rather than sitting under the skin, is the more direct driver. A 2025 study of 515 participants (80.9% female) found that insulin resistance indices were associated with the relationship between reduced muscle mass in the arms and legs, increased visceral fat, and metabolic syndrome. Losing muscle shifts someone toward insulin resistance even without a single pound gained, since muscle tissue is metabolically protective. Lose it, and a layer of defense disappears that nobody notices going missing.
Hormones play a real role too, and PCOS is probably the clearest case. Insulin resistance is closely implicated in PCOS, though PCOS is multifactorial and researchers still debate the exact causal order of its features. HOMA-IR sits at the center of both diagnosing and tracking treatment in PCOS patients. A 2025 study comparing 92 PCOS patients against 68 healthy controls found significantly higher visceral adiposity and markers of dysfunctional fat tissue in the PCOS group.
Menopause carries its own signal. Research has linked early menopause to elevated insulin resistance risk, and the association often goes undetected because standard screening is not routinely triggered by menopause onset alone.
Sleep deserves more attention than it usually gets in these conversations. Short sleep duration and poor sleep quality both show associations with acute and chronic increases in insulin resistance. It's one of the more overlooked levers, mostly because it doesn't appear on a lab requisition form the way diet or exercise habits do.
Then there's the lipid connection. Insulin resistance disrupts how the body handles lipoproteins, which raises triglycerides and lowers HDL, the classic dyslipidemia pattern seen in metabolic syndrome. Triglyceride levels correlate meaningfully with the presence of insulin resistance. So when an elevated HOMA-IR appears alongside a rough lipid panel, that's one metabolic pattern showing up in two separate measurements, not two unrelated problems that happen to coincide.
HOMA-IR's connection to cardiovascular and long-term mortality risk
Research on cardiovascular risk suggests that HOMA-IR captures a combined signal that neither glucose nor insulin alone reliably reflects. That is the real case for running the calculation instead of stopping at a glucose result and calling it a day. Glucose alone is a weak predictor here. HOMA-IR carries more of the weight.
Age adds another layer. The Toledo Study of Healthy Ageing, a prospective cohort that followed 991 non-diabetic older adults, measured insulin resistance with HOMA-IR at baseline and tracked frailty over five years. Insulin signaling declines with age in ways that affect skeletal muscle function and, downstream, longevity itself. The study linked baseline insulin resistance to frailty outcomes during that follow-up window.
Insulin resistance is an independent risk factor that accrues consequences over time, which is reason enough to track the number regardless of sex.
Stepping back, the bigger picture comes into focus. Insulin resistance can go undiagnosed for a decade or longer, and during that entire window it acts as an independent risk factor, not just for diabetes but for cardiovascular disease, high blood pressure, and faster biological aging. Catching it early does more than head off a future diabetes diagnosis. It shrinks the length of time the body spends absorbing quiet, subclinical damage, damage that only becomes visible on a glucose test once it's already done.
The cost of fasting insulin testing and its wide price range
HOMA-IR needs two numbers, but fasting glucose is usually already sitting on a standard metabolic panel most people get anyway. The real marginal cost is just the fasting insulin test on its own.
So why does the price bounce around so much depending on where someone orders it? Most direct-to-consumer labs send samples to the same handful of national reference laboratories, so the lab work behind the scenes is identical no matter which company processes the order. What changes is the markup sitting on top of it.
TestWell lists fasting insulin at $22.99, with no doctor's visit required. Pravida Health estimates roughly $35 out of pocket for someone without insurance. Neither price is high in absolute terms, but insurance coverage for fasting insulin isn't guaranteed, and some providers hesitate to order a test they suspect won't get reimbursed. That hesitation, more than the price tag itself, is a big part of why a cheap, straightforward test still ends up underused.
Managing an elevated score and the evidence on reversing insulin resistance
No single validated treatment algorithm exists for reversing early-stage insulin resistance. Lifestyle change is where the evidence consistently points, and by a wide margin, which makes the flood of supplements and quick-fix protocols marketed for this problem mostly noise. Skip them.
Exercise carries a good chunk of that evidence. High-intensity interval training or resistance training, done alongside an eating pattern centered on vegetables, whole grains, and healthy fats, produces the biggest improvements in HOMA-IR scores among the approaches studied. In practical terms, a consistent weekly schedule is specific enough to act on without turning into a rigid prescription. Resistance training does double duty here: it improves insulin sensitivity directly, and it builds the muscle mass that the body composition research above ties straight back to lower resistance. More muscle, less strain on the pancreas.
Diet works alongside exercise, and together they show the strongest combined effect on HOMA-IR of anything studied: Mediterranean and plant-based eating patterns, paired with HIIT or resistance training. The common thread is fiber, whole grains, fruits, vegetables, and unsaturated fats. The mechanism loops back to the dyslipidemia covered earlier. The quality of dietary fat shapes the same lipoprotein profile that insulin resistance disrupts, so improving one tends to improve the other.
Weight loss matters too, though the number doesn't need to be dramatic. Losing somewhere between 5% and 10% of body weight can meaningfully improve insulin sensitivity. Given what the body composition research shows about visceral fat specifically, fat lost from around the organs is likely doing most of that work, more than total pounds dropped on a scale.