Coronary Artery Calcium Score for Cardiovascular Risk Stratification
Calcium imaging directly measures artery plaque burden better than risk calculators.

The Framingham Risk Score and the pooled cohort equations tell a patient the odds of a heart attack over the next decade. They cannot tell that patient what is already sitting inside their own arteries. Both tools work from demographic variables and conventional risk factors: hypertension, diabetes, dyslipidemia, smoking. They produce a probability, not a measurement. A prospective cohort study published in Bioinformation makes the limitation explicit, noting that traditional models "estimate probability rather than directly measuring atherosclerotic burden and may underestimate risk in certain individuals. Atherosclerosis builds for decades before it announces itself, so a patient can score low or intermediate on every standard calculator while plaque accumulates quietly in the coronary wall. What would it take to actually see that burden, rather than infer it from a questionnaire?
What a CAC scan measures and the Agatston score
A coronary artery calcium scan answers that question directly. It is a non-contrast CT scan, requiring no injection, no IV line, no exercise, and, in many settings, no physician referral to obtain. The scan is gated to the heartbeat: sensors on the chest synchronize the imaging with each cycle, and low-dose CT captures the coronary arteries at the right moment in that cycle. The output is the Agatston score, a weighted sum of calcified lesion areas, with the weighting tied to how dense the calcium appears on the scan.
That calcium is the physical endpoint of a long inflammatory sequence, in which lipid accumulates in the artery wall, macrophages move in, foam cells form, and a necrotic core eventually calcifies. A high score reflects the cumulative weight of that process over years, not the danger of any single lesion today. Scores follow a standard visual convention. Zero means no detectable calcification. One to ten is minimal. Eleven to a hundred is mild. A hundred and one to four hundred is moderate. Anything above four hundred is severe. A 2025 narrative review in Cureus notes that calcium above a high-density threshold links to a reduced chance of acute coronary syndrome, because denser calcium tends to mark older, more stable plaque. The number alone is a starting point. Density and distribution shape what it actually means.
How strongly CAC score predicts future cardiovascular events
A measurement is only useful if it predicts something. CAC clears that bar with room to spare. The 2026 Bioinformation cohort study found that each 100-unit rise in CAC score independently nearly doubled cardiovascular risk (HR 1.92, p=0.001), and patients with a score of 400 or above carried the heaviest burden of events across heart attack, stroke, and cardiovascular death. Folding CAC into traditional risk models in that same cohort produced a net reclassification improvement of 0.24, with a sizable share of patients landing in a different risk category once the scan results were added to the picture.
This is not a one-study finding. The Multi-Ethnic Study of Atherosclerosis, the large dataset that underpins most current guideline thresholds, showed CAC predicts 10-year cardiovascular events, improves reclassification beyond the standard scores, and reliably identifies people at very low risk. The Cureus review found CAC outperformed the traditional ASCVD score, the MESA risk score, and the Rotterdam Study among higher-risk patients in head-to-head comparison. A fair objection deserves airtime here: no large randomized trial has yet shown that CAC-guided care reduces all-cause mortality in early follow-up, so the evidence base so far is prognostic. Risk reclassification and clearer treatment guidance already carry real value for patients making decisions today, without waiting on a trial design that takes years to mature.
The 2026 ACC/AHA guideline upgrade and its implications for clinical practice
Evidence is one thing. Formal endorsement is another, and 2026 brought it. The ACC/AHA/Multisociety Dyslipidemia Guideline elevated CAC scoring to a Class 1 recommendation, the strongest tier a guideline can assign, reserved for interventions where benefit clearly outweighs risk based on solid evidence. That is the single most significant recent shift in how preventive cardiology treats this test.
The guideline also ties CAC results directly to LDL-C targets. A score of 100 or above, or a result above the 75th percentile for age, sex, and ethnicity, calls for an LDL-C goal below 70 mg/dL. For scores between roughly 300 and 999, that same sub-70 target remains the primary goal, with tightening to below 55 mg/dL considered reasonable if needed, a Class 2a recommendation reflecting slightly less certainty than a Class 1 call. Only at a score of 1000 or above does a target below 55 mg/dL become the primary Class 1 recommendation, treating that patient's risk as comparable to someone with established clinical cardiovascular disease. The guideline also carved out a Class 2a recommendation for repeat scanning within three to seven years in intermediate- or borderline-risk patients who score zero and prefer to hold off on lipid-lowering therapy, giving those patients a structured way to defer treatment. CAC has moved from a specialist's extra tool to a guideline-backed first-line option for exactly the patients who are hardest to counsel: the borderline, intermediate-risk group where a calculator alone leaves too much unresolved.
Reading the number: what each score range means for prevention decisions
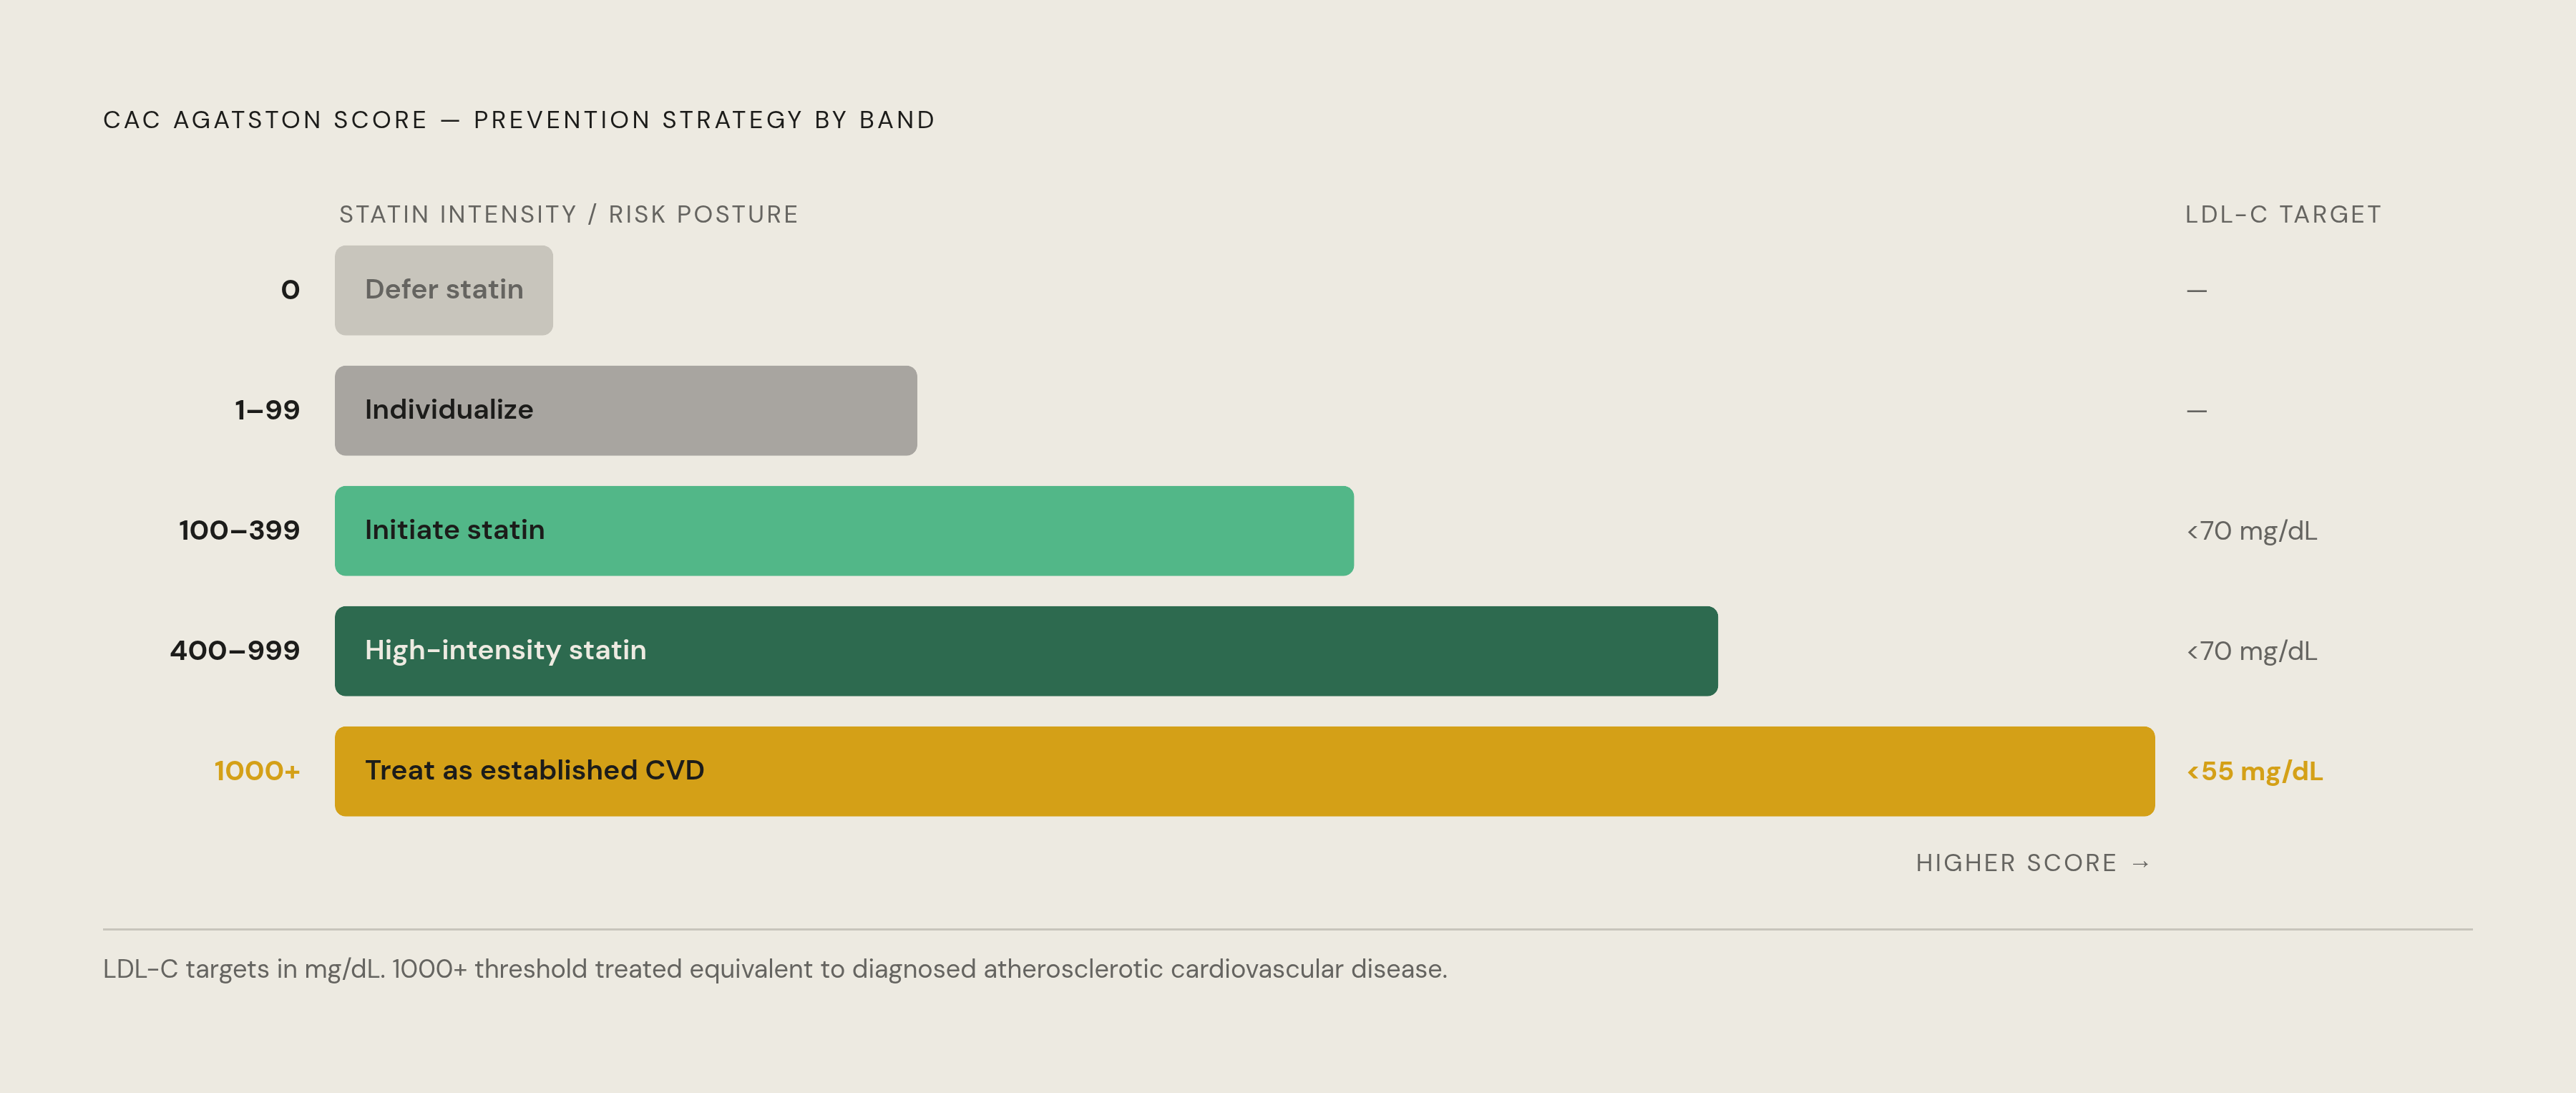
A score only becomes useful once it is translated into a decision, and each range on the CAC scale maps to a different prevention posture. A score of zero carries a very low annualized event rate and can support deferring statin therapy in a low- or intermediate-risk patient without other cardiovascular comorbidities. Research out of Intermountain Health confirmed that a zero score is a highly accurate predictor of low risk for heart attack and overall mortality, regardless of the patient's age. Scores between 1 and 99 sit in murkier territory. Here the result is neither a green light to defer treatment nor a trigger to start it. Family history, other risk factors, and the patient's own preferences carry more of the decision than the number itself.
Once a score reaches 100 to 399, the guidance sharpens toward statin initiation and optimization, with an LDL-C target below 70 mg/dL. From 400 to 999, high-intensity statins become indicated. Above that, at the highest end of the scale, the recommendation turns to aggressive LDL-C lowering and closer follow-up, with the patient's risk treated much like someone who already has diagnosed cardiovascular disease, and an LDL-C target below 55 mg/dL comes into consideration. One more wrinkle matters for anyone reading their own result: the percentile. Scoring above the 75th percentile for a given age, sex, and ethnicity carries clinical weight on its own, even if the raw number looks only moderately elevated. None of these ranges function as a verdict handed down by a machine. They function as a map that a clinician reads alongside the full clinical picture, with the number informing the conversation about prevention.
The statin paradox: why a rising CAC score on therapy is not a treatment failure
A patient starts a statin, does everything asked of them, and six months or a year later gets rescanned only to find their CAC score went up. That result feels like bad news. It almost always is not. High-intensity statins and other lipid-lowering therapies can raise the Agatston score while actually lowering the risk of a cardiovascular event, a paradox with a clear biological explanation most appointments don't leave enough time to cover.
Statins work in part by stabilizing plaque that was previously soft and prone to rupture. That stabilization process adds calcium to the lesion, which raises the score on the scan, but the plaque becomes denser and more stable in the process, and denser, more stable plaque is less likely to rupture and cause an acute event. The REPRIEVE mechanistic substudy, run out of Massachusetts General Hospital and Harvard Medical School and published in 2024, built its design around this exact distinction. The study prespecified non-calcified plaque, not the CAC score, as its primary outcome, because non-calcified plaque is the biologically active component that actually shrinks under statin therapy even as the calcium score climbs. For a patient on treatment, a rising score should open a conversation about this paradox, not trigger an automatic escalation of the medication or a conclusion that the drug isn't working. It also explains why guidelines classify serial scanning as a Class 2a recommendation. The score is built to track risk in people who are not yet being treated. It was never designed to work as a dashboard for measuring a therapy's success.
CAC's blind spots: non-calcified plaque and younger women
CAC's central limitation is that it only sees calcium. Non-calcified plaque, the softer, biologically active material most prone to rupture, is invisible to the scan. A zero score means zero calcified plaque. It does not mean zero plaque of any kind, and that distinction matters most for a handful of specific groups.
Calcification tends to appear roughly a decade later in women than in men. Within the MESA cohort, a much larger share of women scored zero compared with men of the same age, which means a reassuring-looking zero in a 45-year-old woman with real risk factors, like a family history of early heart disease or high cholesterol, carries different weight than the same zero in a 45-year-old man. The Cureus review cautions specifically against over-trusting a zero score in symptomatic young adults, especially young women, because soft plaque unaccompanied by calcium is more likely to be the dominant finding in that group. The same caution extends to people with HIV, who can carry substantial non-calcified plaque burden even with a zero CAC score, and to younger adults generally, regardless of sex. There's an economic angle here too: CAC-guided prevention shows favorable cost-effectiveness in intermediate-risk men, but the cost per quality-adjusted life year climbs substantially in women and in lower-risk groups overall. None of this makes CAC a flawed tool. It makes CAC a tool with a known shape, and a zero score in a younger woman with risk factors is a reason to keep asking questions, not a reason to close the file.
How CAC performs in diabetes
Diabetes has long been treated in cardiology as risk enough on its own, a diagnosis that places a patient automatically into a higher-risk category regardless of other detail. CAC scoring complicates that assumption in a useful way. Within the MESA cohort, adults with diabetes who scored zero on CAC had very low rates of coronary heart disease events, even when their diabetes had lasted for years or their calculated risk score ran high by conventional measures. Adults with diabetes who scored 400 or above saw event rates exceeding 20 per 1,000 person-years, a gap wide enough to separate two people who, on paper, look like the same patient.
That gap only deepens the point. HbA1c, insulin use, and how long someone has lived with diabetes added no meaningful predictive value once CAC was factored into the model. Two patients can carry identical HbA1c numbers and the same years since diagnosis and still face sharply different cardiovascular futures, and CAC is the measurement that reveals which future each one is heading toward. Diabetes, in other words, is not a monolith for cardiovascular purposes. It contains real variation that a direct measurement of plaque burden catches and a proxy marker like blood sugar control cannot.
Serial CAC scanning and CAC progression
Progression in CAC score over time, when it happens in someone not on lipid-lowering therapy, carries its own independent prognostic signal, separate from the single-scan score. That much is established. What follows from it is a narrower, more practical question: when does a second scan actually change what a clinician recommends?
The 2026 guideline's Class 2a recommendation for repeat scanning answers that question for one specific group, intermediate- or borderline-risk patients who scored zero initially and want to hold off on medication. For them, a rescan within three to seven years gives a structured checkpoint. For someone already on a statin, the calculus runs differently, for the reasons the paradox section lays out. A rising score on treatment is expected and is not itself a reason to reorder the plan. Serial CAC scanning earns its place when it answers a question that changes management, deferral in an untreated patient, confirmation of continued low risk, a recalculated LDL-C target as a score crosses a threshold. It does not function as a routine scoreboard for everyone on every schedule, and reading it that way is where its real value gets lost.
Sources
- Beyond Traditional Risk Calculators: The Expanding Role of Coronary Artery Calcium Scoring in Preventive Cardiology
- Coronary artery calcium scoring for cardiovascular risk stratification: A prospective cohort study - PMC
- Is there a role for measuring coronary artery calcium progression in 2026? - PMC
- Role of Coronary Artery Calcium Score CT in Risk Stratification of Asymptomatic Individuals