Building a Personal Health Data Record From Lab Results
Tracking lab results over time reveals health trends that a single test result can never show.

Lab results are the closest thing most people have to an objective record of their own body, tracked over time. Yet almost everyone treats each result as a one-time pass or fail, then forgets about it. Building a personal health data record around your labs turns those scattered snapshots into something else entirely: a story of where your health has been and where it's actually heading.
What a personal health data record is, and why lab results belong at its center
A personal health data record, or PHR, is exactly what it sounds like: a record you own and maintain yourself. Medications, allergies, immunizations, past diagnoses, imaging reports, provider contacts, lab results. All of it, in one place, under your control.
That last part is the whole distinction. An electronic health record, or a patient portal your doctor's office gives you access to, lives inside a system that belongs to the provider. You can look at it. You might even be able to download pieces of it. But it isn't yours the way a PHR is yours. Roughly 95% of office-based physicians in the United States now use some form of EHR system. Your data exists somewhere. The question is whether you've ever pulled it out of that somewhere and put it into something you actually control.
Lab results deserve the center seat in this record for a few concrete reasons. They're quantitative and repeatable, so unlike a clinician's note or a written symptom description, you can graph them. A number from March compares cleanly to a number from September. They also reflect the body's internal chemistry directly, often shifting well before any symptom shows up to explain why. And practically speaking, labs are the one data type most people accumulate across years and multiple providers, so they're the most complete longitudinal thread available.
None of this is theoretical anymore, either. FHIR interoperability standards and open APIs on patient portals now make it technically possible to pull your own data out of provider systems. The idea of health data actually following the patient, rather than sitting locked in whichever system ordered the test, is an active infrastructure project. Not a far-off promise.
The biomarker categories worth tracking and what each one reveals over time
Six categories cover most of what matters, and each tells a different part of the story.
Metabolic markers, glucose, fasting insulin, HbA1c, and triglycerides, show how efficiently the body processes fuel. Fasting insulin tends to rise years before HbA1c crosses into prediabetic territory, making it one of the earliest warning signs available from routine blood testing.
Lipid and cardiovascular markers go beyond the familiar LDL-C number. ApoB counts the actual number of artery-clogging lipoprotein particles in circulation, and a growing body of clinical opinion treats it as a more accurate predictor of cardiovascular risk than LDL-C alone. Lp(a) rounds this category out as a genetic risk factor, one that reflects inherited cardiovascular risk rather than lifestyle-driven variation.
Inflammatory markers, mainly hs-CRP, capture systemic inflammation as a background condition rather than a single event. Micronutrient status, vitamin D, B vitamins, magnesium, iron, zinc, catches deficiencies that build quietly and chip away at energy, recovery, and cognitive sharpness. Hormonal markers, cortisol, testosterone, estrogen, TSH and thyroid function, reflect how sleep, stress, and metabolic load interact over time. And the Complete Blood Count paired with the Comprehensive Metabolic Panel forms the baseline layer: the CBC as an inventory of blood cells, the CMP as a read on blood sugar, electrolytes, liver function, and kidney function.
A single result is a data point. It's a data point. Reference ranges are also graduated rather than binary, so a mildly elevated vitamin D reading gets treated differently than a genuine deficiency. Context, in other words, carries more weight than any one number sitting slightly outside a range.
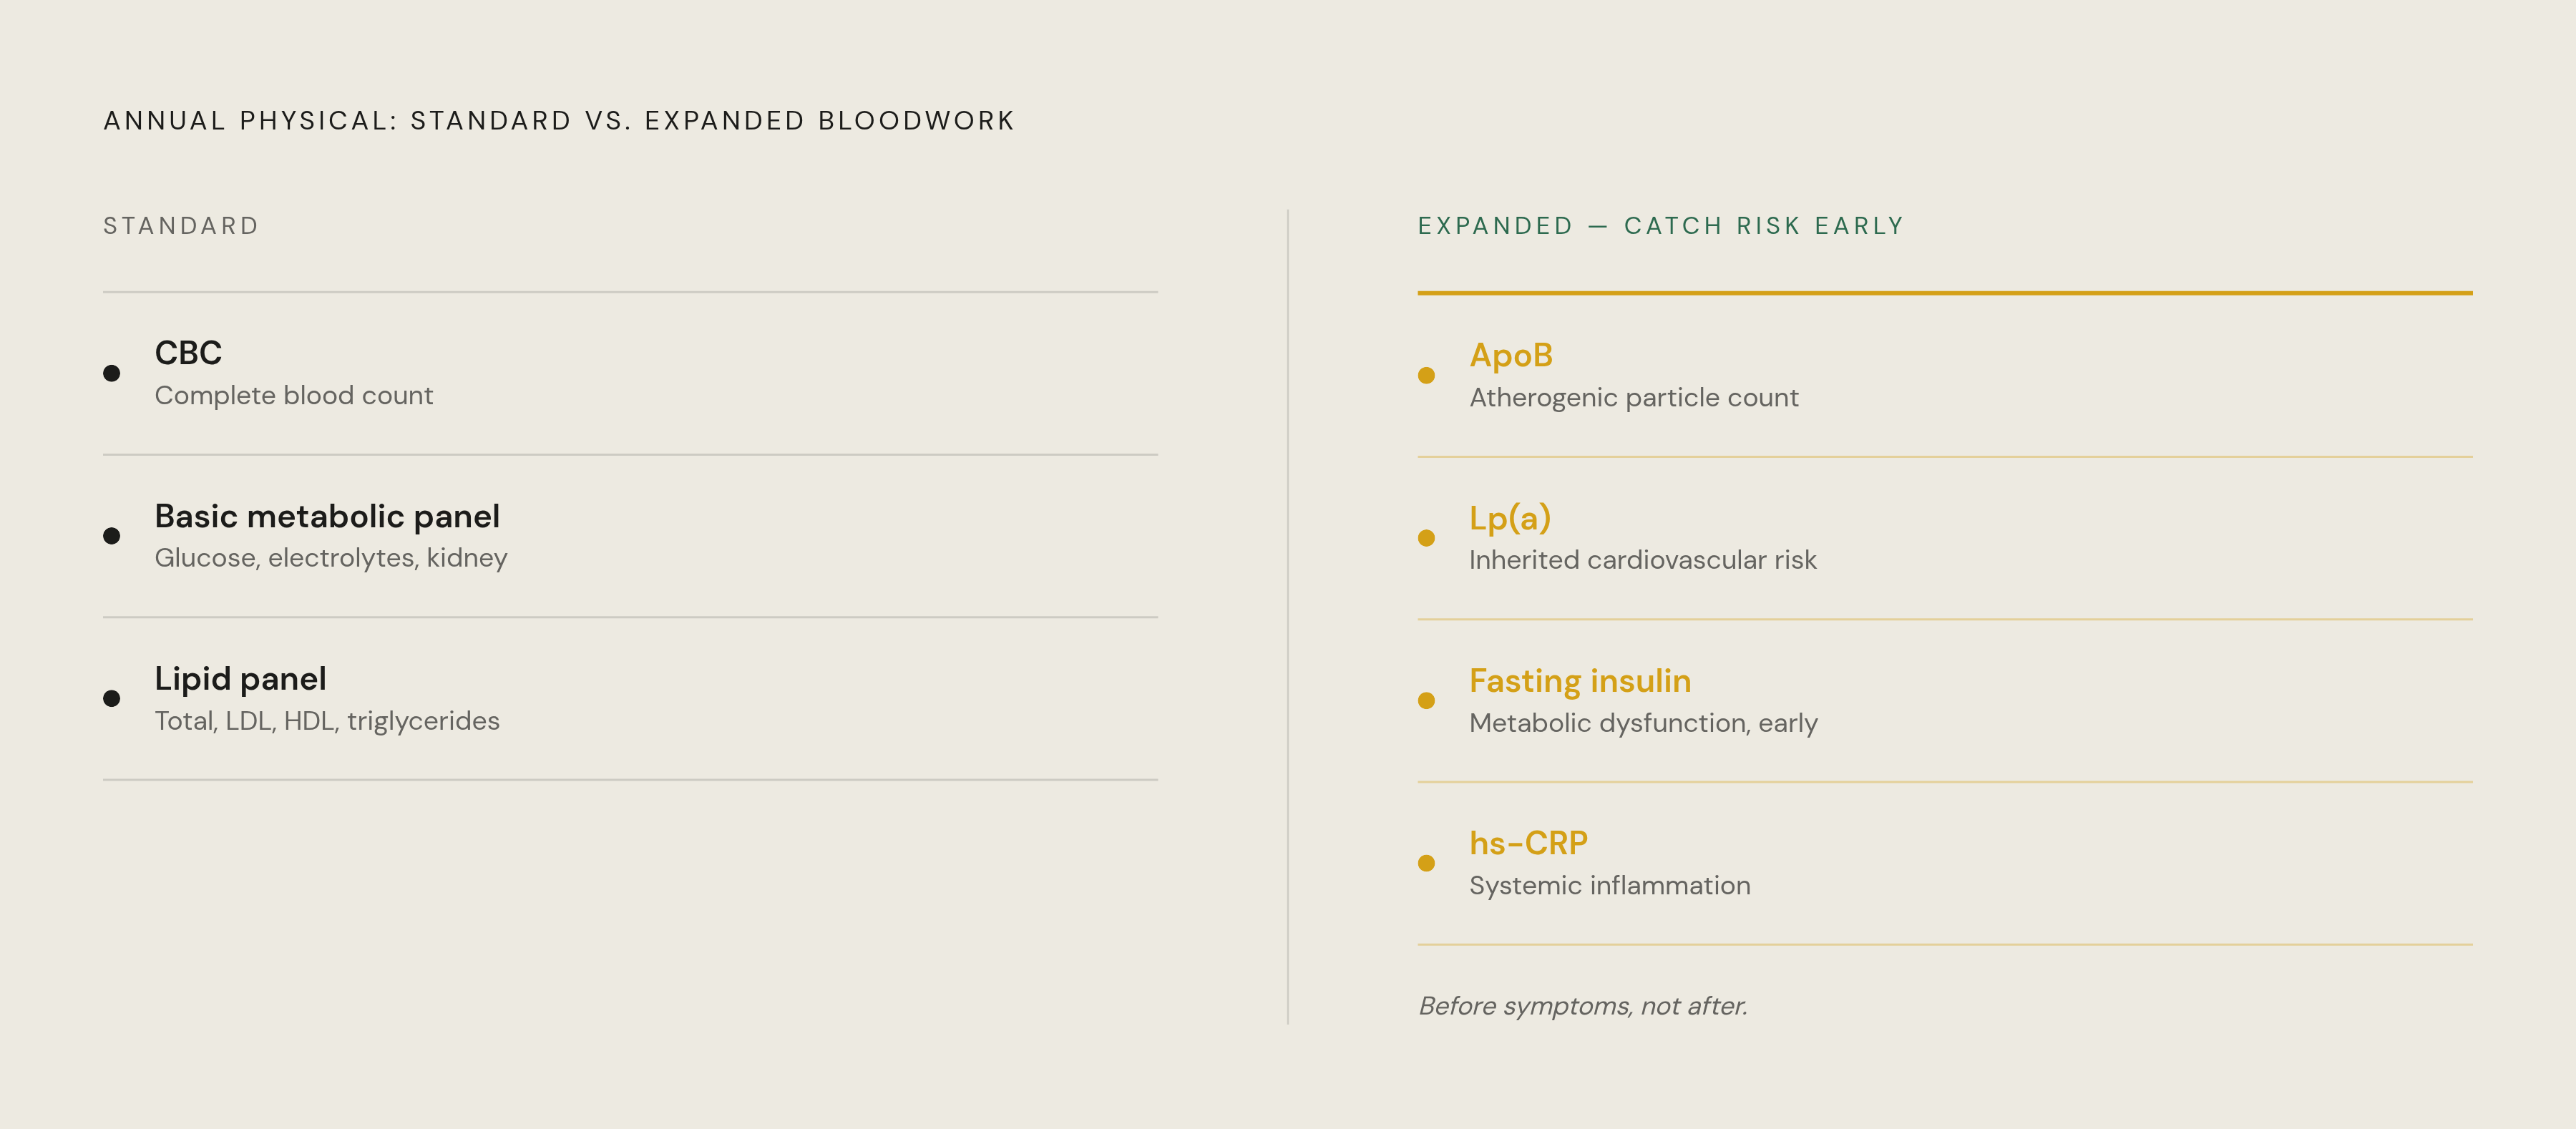
A typical annual physical commonly includes a CBC, a basic metabolic panel, and a lipid panel. Longevity-focused clinicians tend to add ApoB, Lp(a), fasting insulin, and hs-CRP on top of that. That gap between the two lists reflects the difference between testing for existing problems and tracking risk before problems develop.
How a trend line changes the meaning of a result that looks normal in isolation
A result sitting inside the reference range isn't necessarily a stable result. It might be moving steadily toward the edge of that range, one test at a time.
Take fasting glucose. A reading that sits comfortably inside the reference range can still be moving steadily toward its edge. A result that looks reassuring in isolation may represent a meaningful directional shift when placed alongside earlier readings from the same person. That's a trend, flagged long before any number ever crosses into abnormal territory.
Research tracking adults free of cardiovascular disease at baseline has found something that should reframe how anyone reads a lipid panel: LDL-C and non-HDL-C can underestimate ApoB. A cholesterol panel that looks reassuring year after year might still be masking real cardiovascular risk, which appears only when you measure particle count directly.
This is the practical argument for building the record in the first place. The trend is the signal. The single snapshot, by design, is incomplete.
How to collect your lab results from the sources they currently live in
Results tend to live in three places, and each one takes a slightly different approach to retrieve.
Provider patient portals are the first stop. Many major EHR platforms now support FHIR-compatible API access, so requesting your own data as a structured export is often just a matter of finding the right menu. Paper printouts and old PDF reports are the second category, and here the process is manual: scan or photograph what exists, then enter the key values into whatever tracking system you've chosen. Direct-to-consumer lab platforms are the easiest of the three. Results usually show up in the dashboard right away and download cleanly as a PDF or as structured data.
Nationwide frameworks like TEFCA are working to connect regional systems so records follow the patient across providers, building on the same FHIR standards mentioned earlier. That infrastructure is being built now, not finished.
A few practical snags can arise before anyone starts this project. Portals often expire access after a stretch of inactivity, so download results soon after they post rather than assuming they'll sit there indefinitely. Older results may exist only on paper, which can mean a formal records request rather than a quick download. And timing varies by source: some providers sit on results for a few days before releasing them, while direct-to-consumer labs typically release immediately.
One more wrinkle: New York, New Jersey, and Rhode Island restrict direct-to-consumer lab ordering, so residents of those states may need a physician's order for certain panels.
How to organize the data so it is usable, fields, formats, and tracking structure
A record is only useful if the fields are consistent enough to compare across time. Every entry needs a handful of things: the test date, the biomarker name (standardized, since labs love to abbreviate the same marker three different ways), the result value and its unit of measurement, the reference range that lab used at the time, the ordering context, and which lab or platform ran the test.
That ordering context field matters more than it sounds like it should. A cortisol result drawn at 8 a.m. and one drawn at 3 p.m. are not comparable numbers, even if they came from the same person on the same week. Was the sample fasted? Was there an acute illness in play? Was this a morning draw for a hormone that swings by time of day? Skipping that context turns the record misleading rather than useful.
Structurally, organize by biomarker over time, not by visit. One column per biomarker, one row per date, so a glance down the column reveals the trend instantly. Organizing by visit instead buries that pattern inside a pile of unrelated numbers.
On format, three options cover most people. A spreadsheet is the flexible, portable baseline, and it costs nothing but a little setup time. Dedicated PHR platforms built on FHIR and open API standards can import lab data directly, cutting out manual entry. And direct-to-consumer lab platforms that store results natively over time are the most frictionless option when that's where the testing already happens, since there's no export step at all.
Reading your own results without over-interpreting or under-reacting
Three questions handle almost any new result. Is it within or outside the reference range, and by how much? How does it compare to your own previous results for that same marker? And what was the context when it was drawn, fasted or not, stressed, sick, running on four hours of sleep?
Reference ranges are built from population averages. They're not personalized targets. A result sitting at the edge of "normal" for a broad population sample might not be optimal for a specific person with a specific history, which is part of why the graduated-range principle matters: not every deviation carries equal weight. A mildly elevated marker is a flag to keep watching, not a diagnosis to panic over.
So when does a result actually warrant a call to a clinician versus just staying on the tracking list? A single anomalous number, sitting alone with no prior data to compare against, usually calls for a repeat test before anyone acts on it. Labs make errors, samples get mishandled, one bad night of sleep can shift a marker temporarily. A consistent directional trend across several tests is a different animal, and that's the one to bring to a conversation with a doctor.
What proactive testing catches, and why timing matters
Heart disease, diabetes, certain cancers: these conditions tend to develop over years, sometimes decades, before a symptom ever announces itself. Regular biomarker tracking catches risk factors while the window for doing something about them is still wide open. Wait for symptoms and that window has usually already narrowed considerably.
According to the British Heart Foundation, patients using telemedicine were 76% less likely to be readmitted to the hospital within six months, and 41% less likely to visit A&E, compared with patients on standard care pathways. That gap shows patients whose conditions are watched continuously fare differently from those who are only treated once a crisis hits.
The frontier keeps expanding, too. Medcan brought the Galleri multi-cancer early detection test by GRAIL to Canada in October 2025, a test that analyzes cell-free DNA fragments in blood to look for a cancer signal before any symptom appears. Whatever one makes of any single test, it signals where blood-based screening is headed: earlier, broader, and increasingly capable of surfacing things years before they'd otherwise be caught.
Three markers stand out for moving well ahead of the clinical events they predict. Fasting insulin rises before HbA1c ever crosses the prediabetes line. ApoB reflects cardiovascular risk that can build quietly, often long before any symptom becomes noticeable. And hs-CRP tracks systemic inflammation as a background condition rather than a single alarming spike.
What it costs to keep a lab-based record current, and how to avoid overpaying
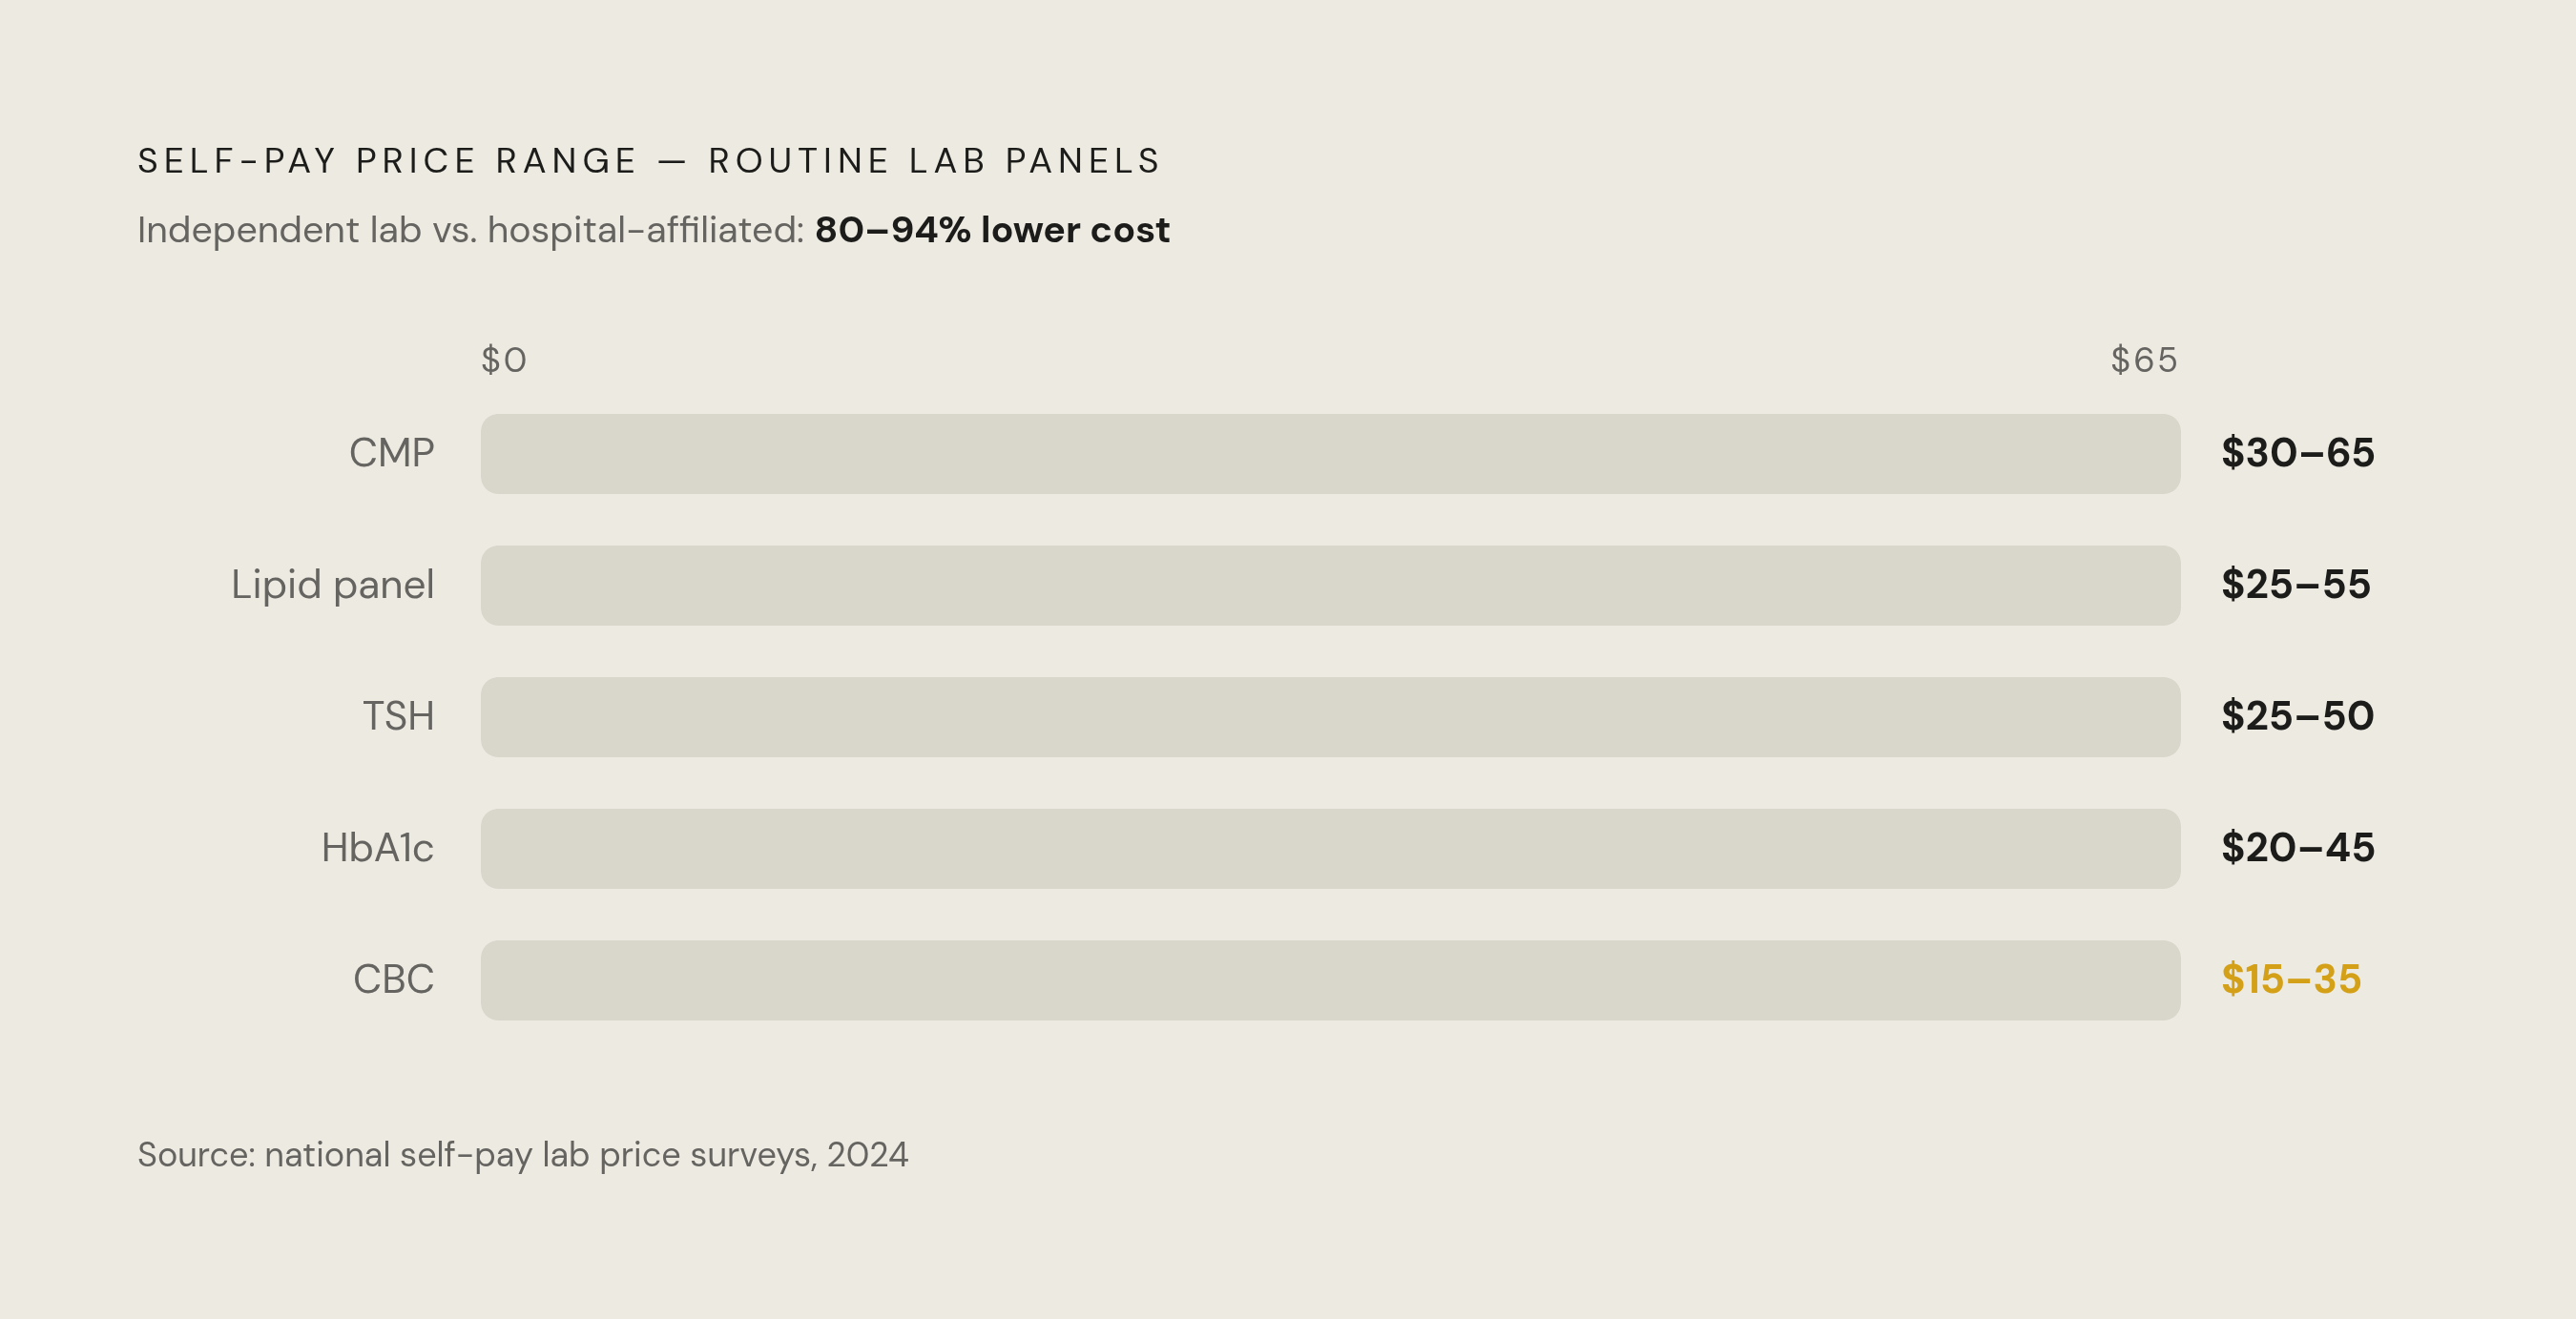
Price varies enormously depending on where the blood gets drawn, and the gap is bigger than most people expect. Hospitals can charge five times more than independent labs for the exact same panel. Choosing self-pay options at independent labs instead of hospital-affiliated draws can cut costs by 80 to 94 percent on routine testing.
For the panels that matter most in a longitudinal record, self-pay benchmark pricing is roughly as follows: a CBC costs between $15 and $35, a CMP between $30 and $65, a lipid panel between $25 and $55, TSH between $25 and $50, and HbA1c between $20 and $45.
Membership-style testing platforms offer another path. One example, Function Health, charges $365 a year, while a third-party estimate valued the à-la-carte cost of the labs included in that membership at $1,114. That gap shows how bundled pricing can undercut retail per-test costs substantially, though it's worth comparing against direct self-pay options too, since the right choice depends on how many markers someone actually wants tracked and how often.
Direct-pay lab tests may be eligible as qualified medical expenses under HSA and FSA rules, though eligibility can depend on individual plan terms. Receipts are worth saving and submitting even when the cost doesn't apply toward a deductible. It's a small thing, but over a few years of regular testing, it adds up.